Deep dive
2026 Has Less Room to Fix a Downturn
Keith Brown · Founding Partner, Outperform Ventures
Nov 20, 2026 · 11 min read

No crisis has been declared in 2026. If one comes, the usual fixes of rate cuts and federal money are harder to use than in 2000, 2008 or 2020.
I read the financial news every morning. This morning most of it said the economy is fine. I wanted to check that against the numbers, the good ones and the bad ones.
I'm optimistic about the long term. We have some of the best entrepreneurs and companies in the world here, and we always make it through. So this article is a fact-finding exercise. It puts the case for calm and the case for worry side by side, and compares 2026 with 2000, 2008 and 2020 on the same measures.
People keep comparing 2026 to 2000, 2008 or 2020. The question I set out to answer is whether it looks like one of them, all three at once, or none. One data point to start: US employers have named AI as the reason for 121,401 announced job cuts this year, according to Challenger, Gray & Christmas, more than double the 54,836 in all of 2025.
A debt crisis occurs when there have been more promises made than there is money to deliver on them.
Ray Dalio wrote that about governments. Federal debt held by the public is 101% of GDP this year, according to the CBO, and interest on it passed $1 trillion. I wrote about his warning signs earlier in Ray Dalio's signs of a bubble.
The case that everything is fine
The calm view has real numbers behind it. The US added 165,000 jobs in October, almost three times the forecast, and unemployment fell to 4.1%. Challenger counted 43,994 announced job cuts in October, the lowest for that month since 2023.
The Federal Reserve's October statement says "economic activity is expanding at a strong pace" and "productivity growth is strong." The IMF projects 2.3% US growth this year and next.
What the calm numbers leave out
The same jobs report has a harder line in it. The average job search reached 27.1 weeks, the longest outside the pandemic since 2016. About 2 million Americans have been out of work for at least 27 weeks, and the broader unemployment rate that counts discouraged and part-time workers rose to 7.9%.
The group I watch most is people starting their careers. From 1990 to 2017, recent college graduates aged 22 to 27 almost always had lower unemployment than workers overall, according to the New York Fed. That flipped around 2018. In April 2025 the gap reached 1.8 points, the widest in the 36 years of data, and in September recent grads were at 5.2% against 4.0% for all workers.
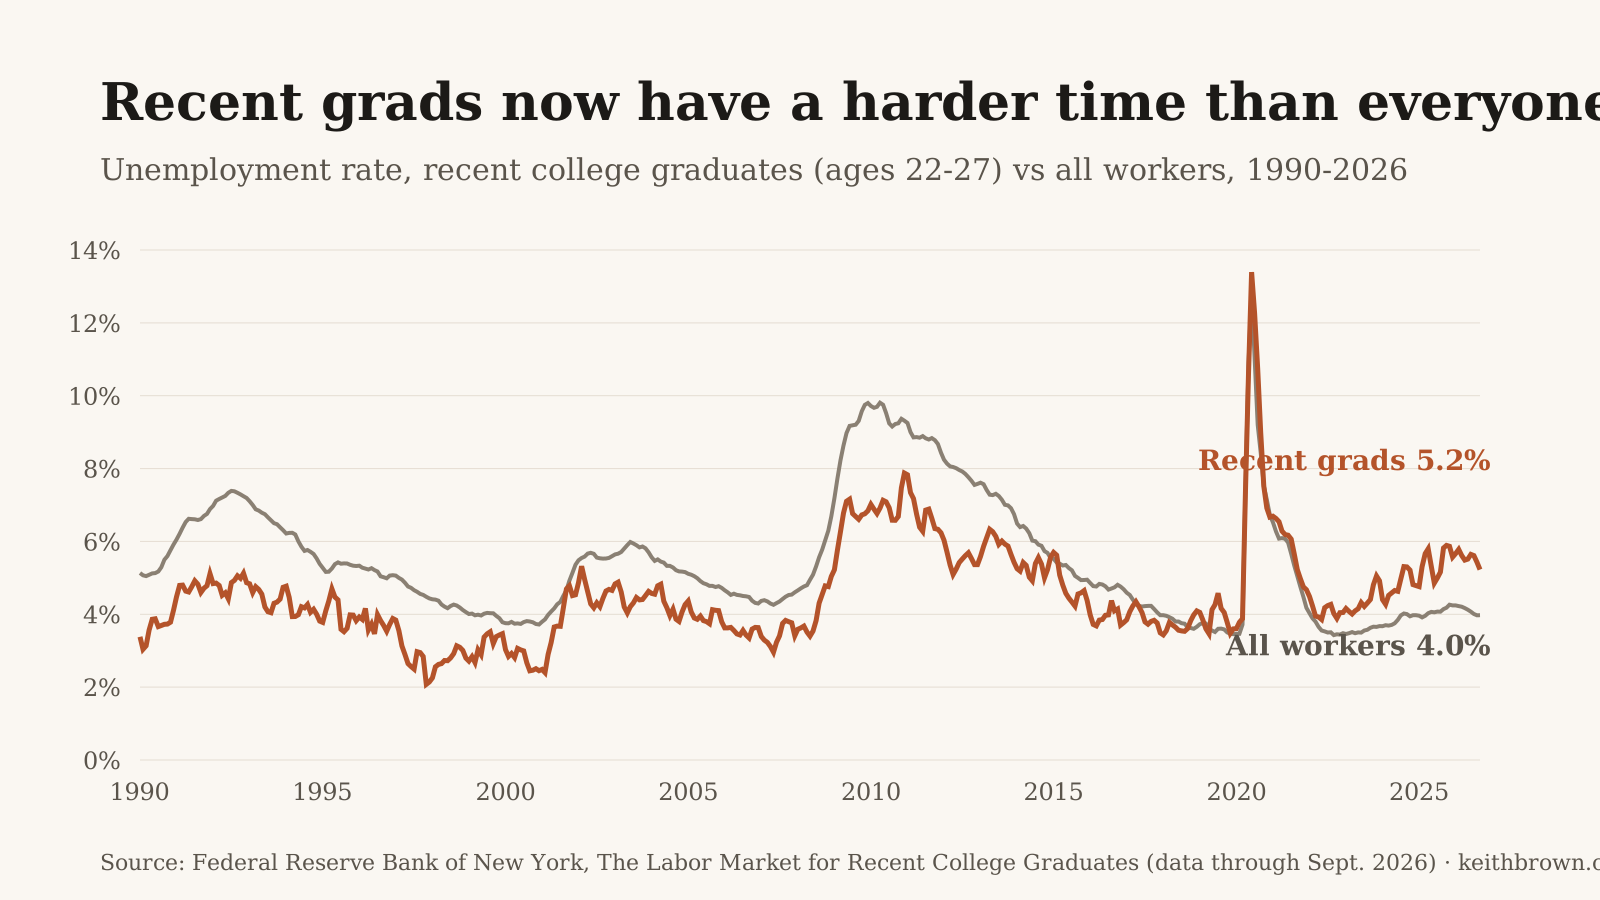
I read that as a leading indicator. Entry-level work is where companies stop hiring first, and it is the work AI does best today. The overall rate is not at a record, and the grad rate has eased from 5.8% in February. But 42.5% of the ones who are working hold jobs that don't need a degree, and the Richmond Fed notes this reversal started before the pandemic and before AI, then kept going.
The Fed's own minutes from that meeting read differently from its statement. Almost all members said further rate increases "would likely be appropriate," and they called AI demand "a material source of inflation risk." Its staff flagged the fast growth of debt behind the AI buildout.
"This is a low-fire environment," Andy Challenger said in the October report. "Employers are holding on to the workers they have heading into the holidays, and the hiring they are announcing is largely short-term, seasonal work."
Isolated or systemic?
Here is the test I use. Is this one battle with a known medicine, or several at once? The 2000 downturn centered on tech. 2008 centered on housing and banks. 2020 was a virus. Each had a main cause and a main fix. The tables below compare each one with 2026 on the same rows, including the rows where 2026 looks better.
Each of the last three downturns had one main cause and one main fix. All three recessions were short by the National Bureau of Economic Research's dates, and all three ended with cheaper money.
2026 compared with 2000
The 2001 recession lasted eight months, from March to November (NBER). The damage centered on internet companies, and unemployment peaked at 6.3% in June 2003 (BLS). The Fed cut rates from 6.5% to 1.75% during 2001.
In 2026 the pressure is not in one sector. Food companies announced 39,370 job cuts through October, the most for that sector since at least 2012, while technology led with 171,501 (Challenger).
| Measure | 2000–2001 | 2026 |
|---|---|---|
| Main cause | Internet stocks and tech spending | Several at once: AI job cuts, inflation, debt, war |
| Where job losses sat | Mostly tech and telecom | Tech leads; food and other sectors also up |
| Unemployment | Peaked at 6.3% (June 2003) | 4.1% (October) |
| Fed policy | Cut from 6.5% to 1.75% in 2001 | Raised a quarter point in September; 3.75% to 4% |
| Inflation going in | 3.0% (March 2001) | 3.7% (September) |
| Fed funds rate going in | 5.3% | 3.9% (October) |
| Total federal debt | 55% of GDP | 121% of GDP |
| Federal budget | Surplus | $1.9 trillion deficit |
| Looks better in 2026 | Unemployment is lower and hiring beat forecasts | |
| Looks worse in 2026 | Less room to cut rates or spend |
Sources: NBER, BLS, Federal Reserve, CBO, Challenger. The 2001 rate path and budget surplus come from Federal Reserve and Treasury records. Inflation, rates and debt "going in" are the month or quarter each recession began, from BLS consumer prices, the effective fed funds rate and total federal debt to GDP on FRED.
2026 compared with 2008
The 2008 crisis started in housing and banks. The recession ran 18 months, from December 2007 to June 2009, and unemployment peaked at 10% in October 2009. By December 2008 the Fed had cut rates to near zero and began buying bonds.
This time the Fed's staff described strong bank and household balance sheets as a buffer. The pressure points the Fed and the CBO name are government debt and inflation.
| Measure | 2007–2009 | 2026 |
|---|---|---|
| Main cause | Housing and bank losses | Several at once: AI job cuts, inflation, debt, war |
| Banks and households | Weak; banks needed rescues | Fed staff call balance sheets strong |
| Unemployment | Peaked at 10% (October 2009) | 4.1% (October) |
| Fed policy | Cut from 5.25% to near zero, then bought bonds | Raising, with more hikes expected |
| Inflation going in | 4.1% (December 2007) | 3.7% (September) |
| Fed funds rate going in | 4.2% | 3.9% (October) |
| Total federal debt | 63% of GDP | 121% of GDP |
| Looks better in 2026 | Banks and households are in better shape | |
| Looks worse in 2026 | Debt is far higher and rates are rising |
Sources: NBER, BLS, Fed minutes, CBO. The 2008 rate path comes from Federal Reserve records. Inflation, rates and debt "going in" are the month or quarter each recession began, from BLS consumer prices, the effective fed funds rate and total federal debt to GDP on FRED.
2026 compared with 2020
The 2020 recession lasted two months, February to April, the shortest on record. Unemployment jumped to 14.8% in April and fell below 7% by the end of the year. Congress passed the $2.2 trillion CARES Act in March, and the Fed cut to near zero.
The 2020 fix was federal money. In 2026 the deficit is $1.9 trillion with no rescue package in place, and the Fed is trying to slow prices.
| Measure | 2020 | 2026 |
|---|---|---|
| Main cause | A virus and shutdowns | Several at once: AI job cuts, inflation, debt, war |
| Length | Two months (February to April) | No recession declared |
| Unemployment | Peaked at 14.8% (April) | 4.1% (October) |
| Fed policy | Cut from 1.75% to near zero | Raised a quarter point in September |
| Inflation going in | 2.3% (February 2020) | 3.7% (September) |
| Fed funds rate going in | 1.6% | 3.9% (October) |
| Total federal debt | 107% of GDP | 121% of GDP |
| Federal response | $2.2 trillion CARES Act | None; deficit already $1.9 trillion |
| Looks better in 2026 | No shutdown; unemployment far lower | |
| Looks worse in 2026 | Inflation limits both rate cuts and new spending |
Sources: NBER, BLS, Federal Reserve, CBO. The CARES Act total and 2020 rate path come from Treasury and Federal Reserve records. Inflation, rates and debt "going in" are the month or quarter each recession began, from BLS consumer prices, the effective fed funds rate and total federal debt to GDP on FRED.
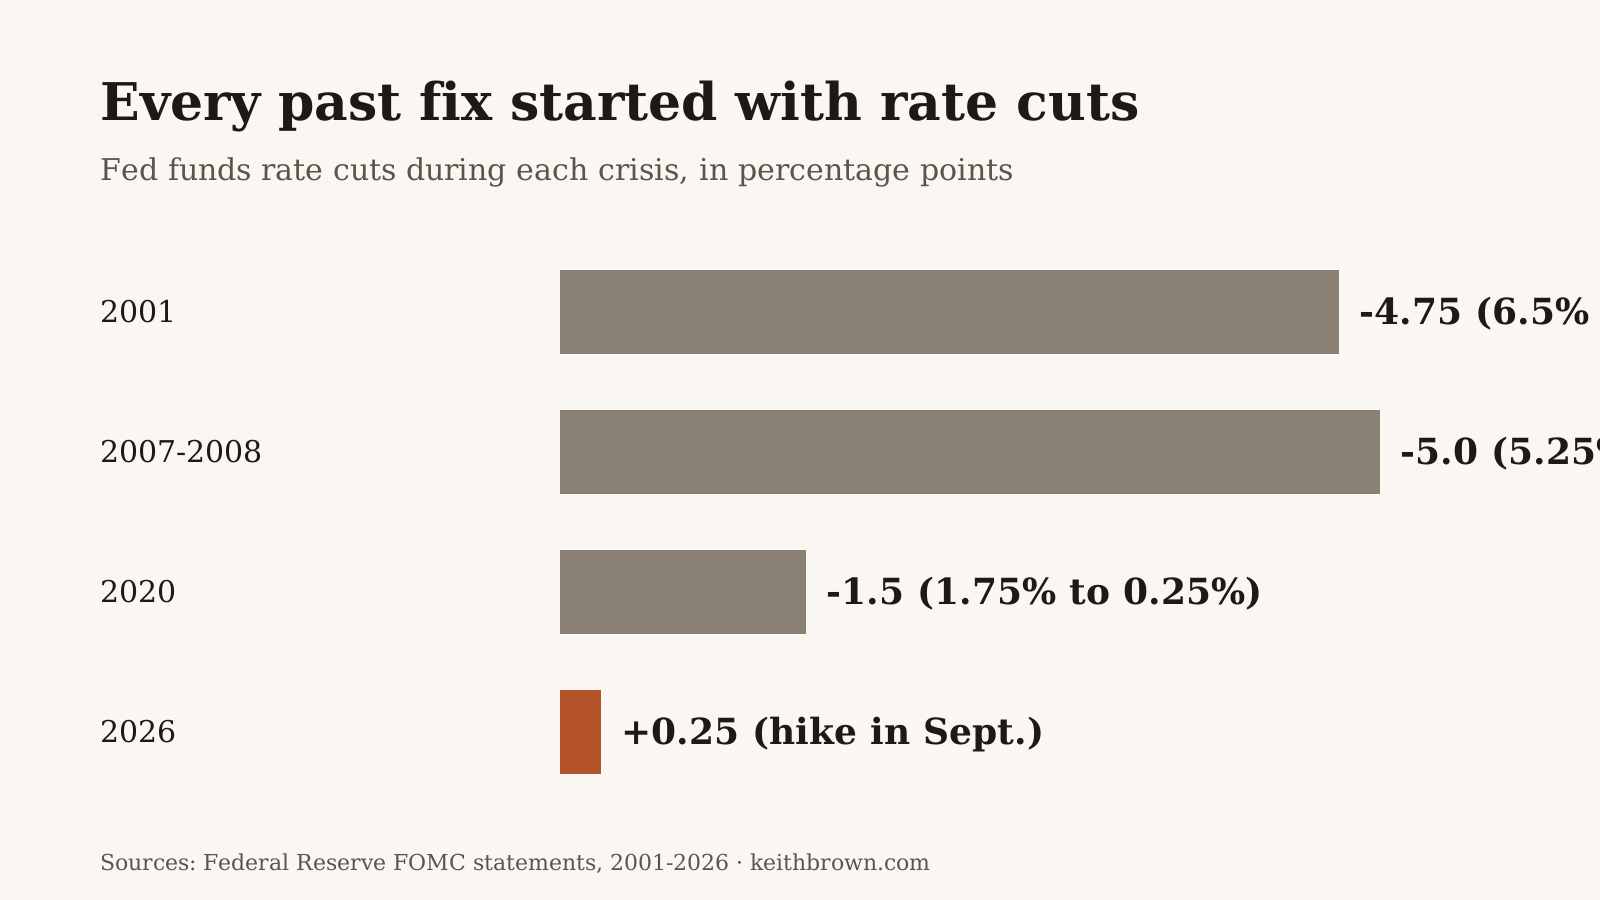
In each past downturn, the first fix was cheaper money. This year the Fed raised rates in September, holds at 3.75% to 4%, and its minutes point to more increases.
AI and job cuts
Through October, US employers announced 617,189 job cuts. They named AI for about one in five of them (Challenger).
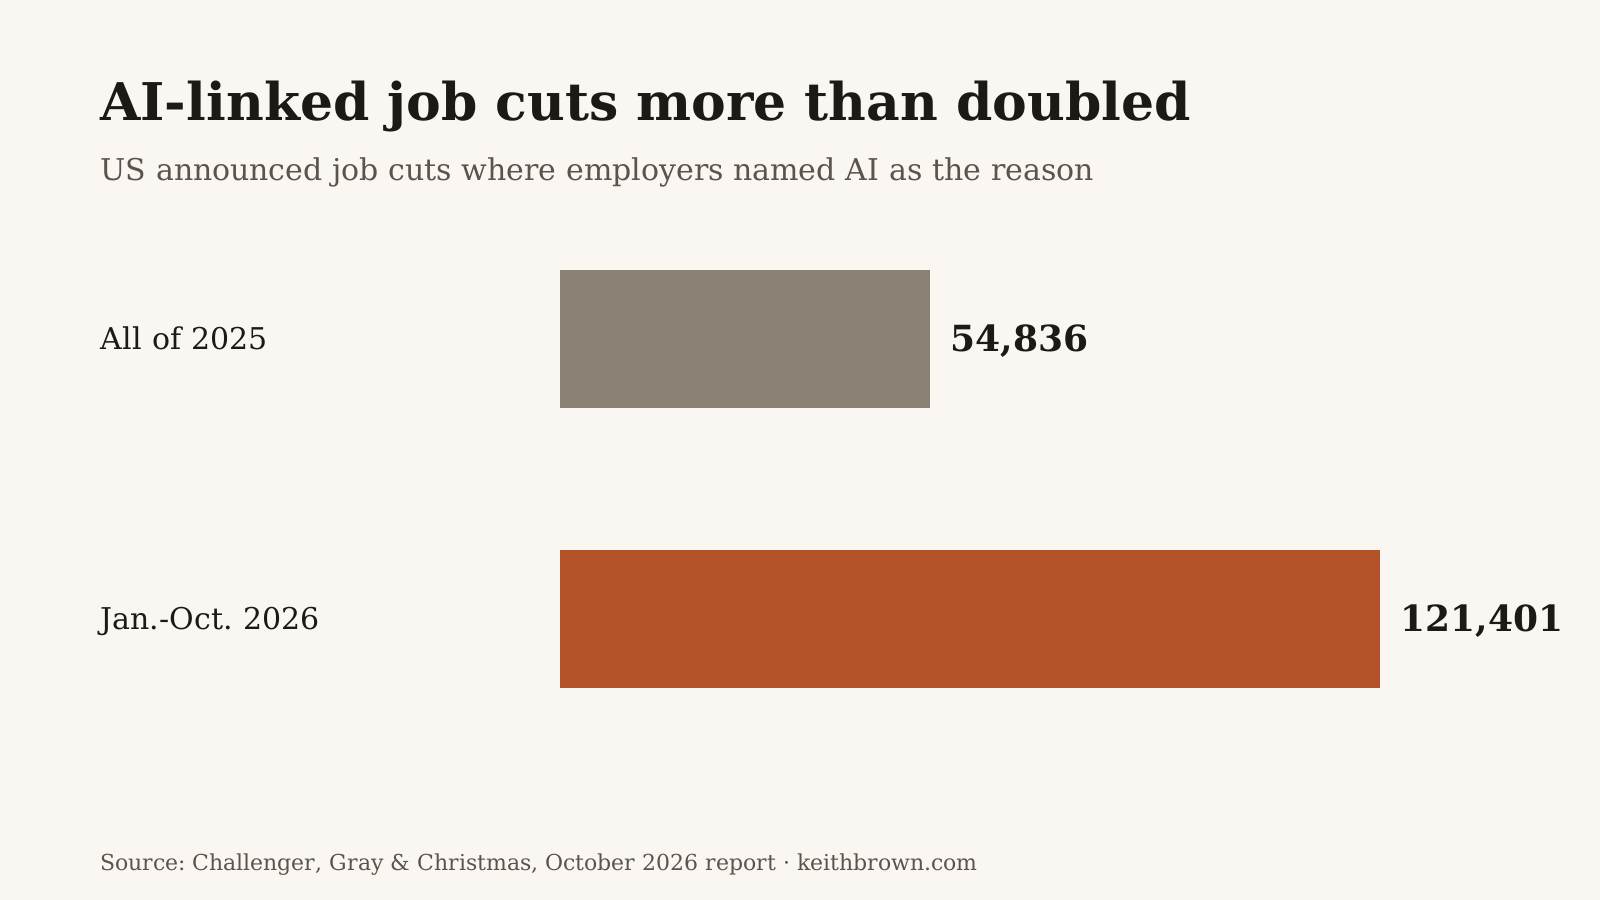
October looked calm. Employers named AI for only 1,265 cuts that month and pointed to the economy instead. The job searches are what got longer: 27.1 weeks on average. I wrote about what happens to the people let go in the whole world is being reskilled in real time.
For scale, 121,401 cuts is about 0.07% of a US labor force of roughly 171 million. AI-linked cuts more than doubled from 2025 to the first ten months of 2026. If we are in the early innings of AI, the count could double again in 2027 and 2028, to roughly 500,000, or about 0.3% of workers. That is a scenario, not a forecast from Challenger.
Outages and cyberattacks
In May, a hack took down Canvas, the learning platform with more than 30 million users, during finals week. In July, a cyberattack knocked out phone and internet service for millions of people in Angola. This month, a Microsoft Outlook and Teams outage lasted about 36 hours across more than 70 countries, and the FAA grounded US flights nationwide for more than four hours (Yahoo Finance).
Microsoft said its outage was not an attack. Most companies now run on a few clouds, so one failure or one breach can stop millions of people at once. These events disrupt work for hours or days, and they sit apart from the jobs, inflation and debt numbers in the rest of this article.
Inflation
US consumer prices rose 0.4% in October after 0.6% in September, the Bureau of Labor Statistics reported, with energy up 5.2% in September alone. Worldwide, the IMF projects inflation of 4.7% this year and 4.1% next year.
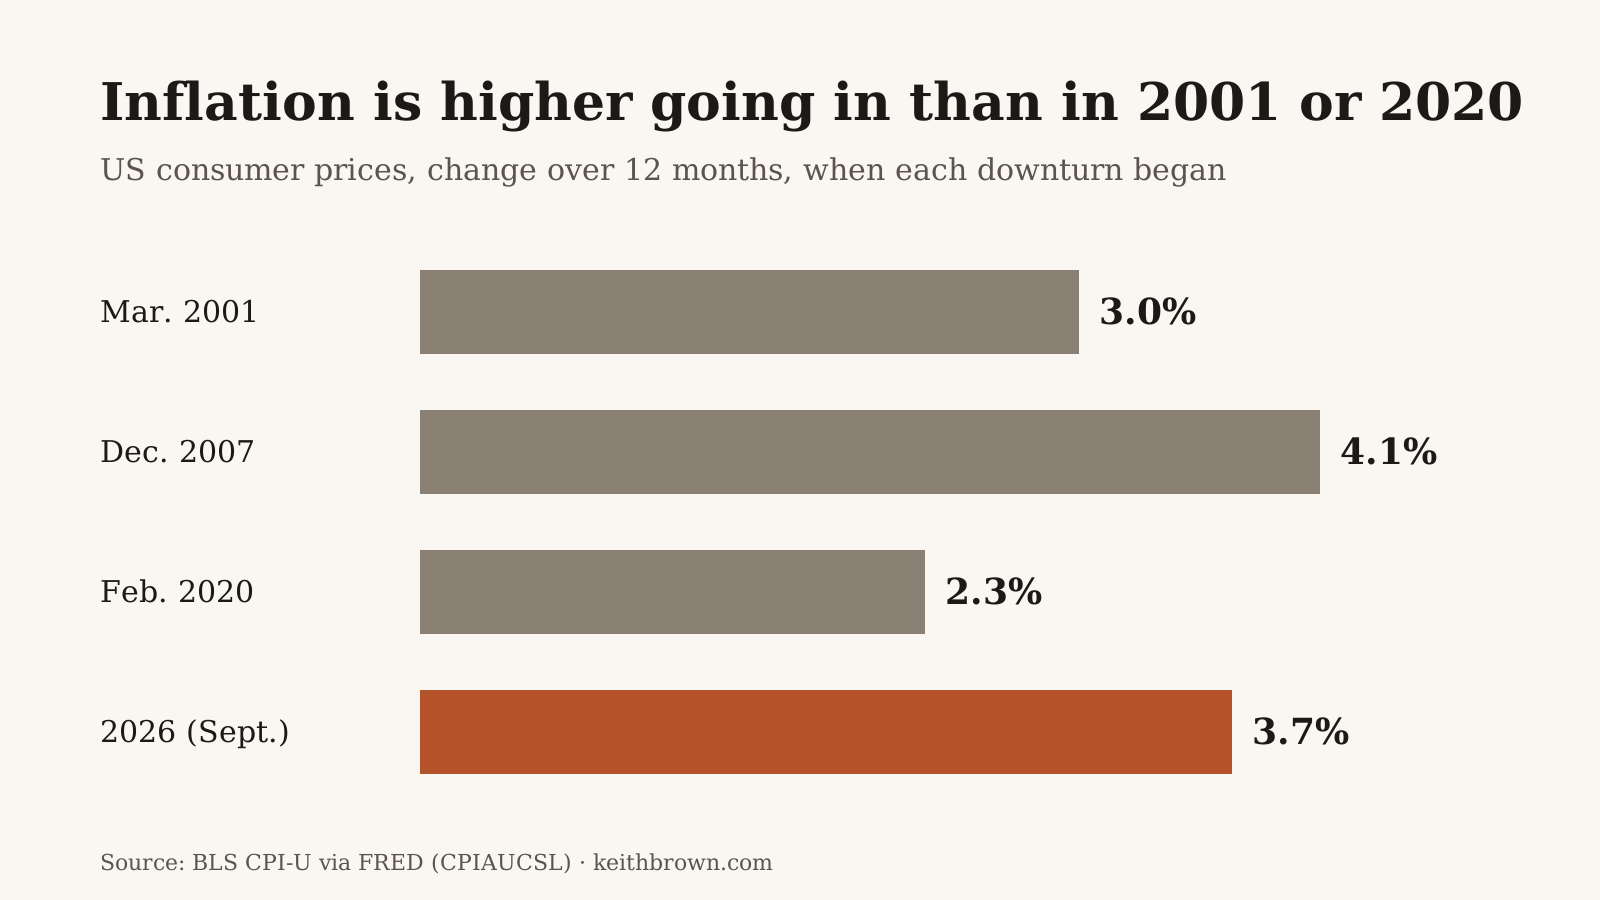
The IMF's forecast assumes oil and gas start moving through the Strait of Hormuz again by March and that AI demand cools. It also assumes oil averages $96 a barrel this year, up about 41%.
Government debt
The Congressional Budget Office projects a $1.9 trillion federal deficit this year. Debt held by the public is 101% of GDP and rises to 120% by 2036, past the record of 106% set in 1946.
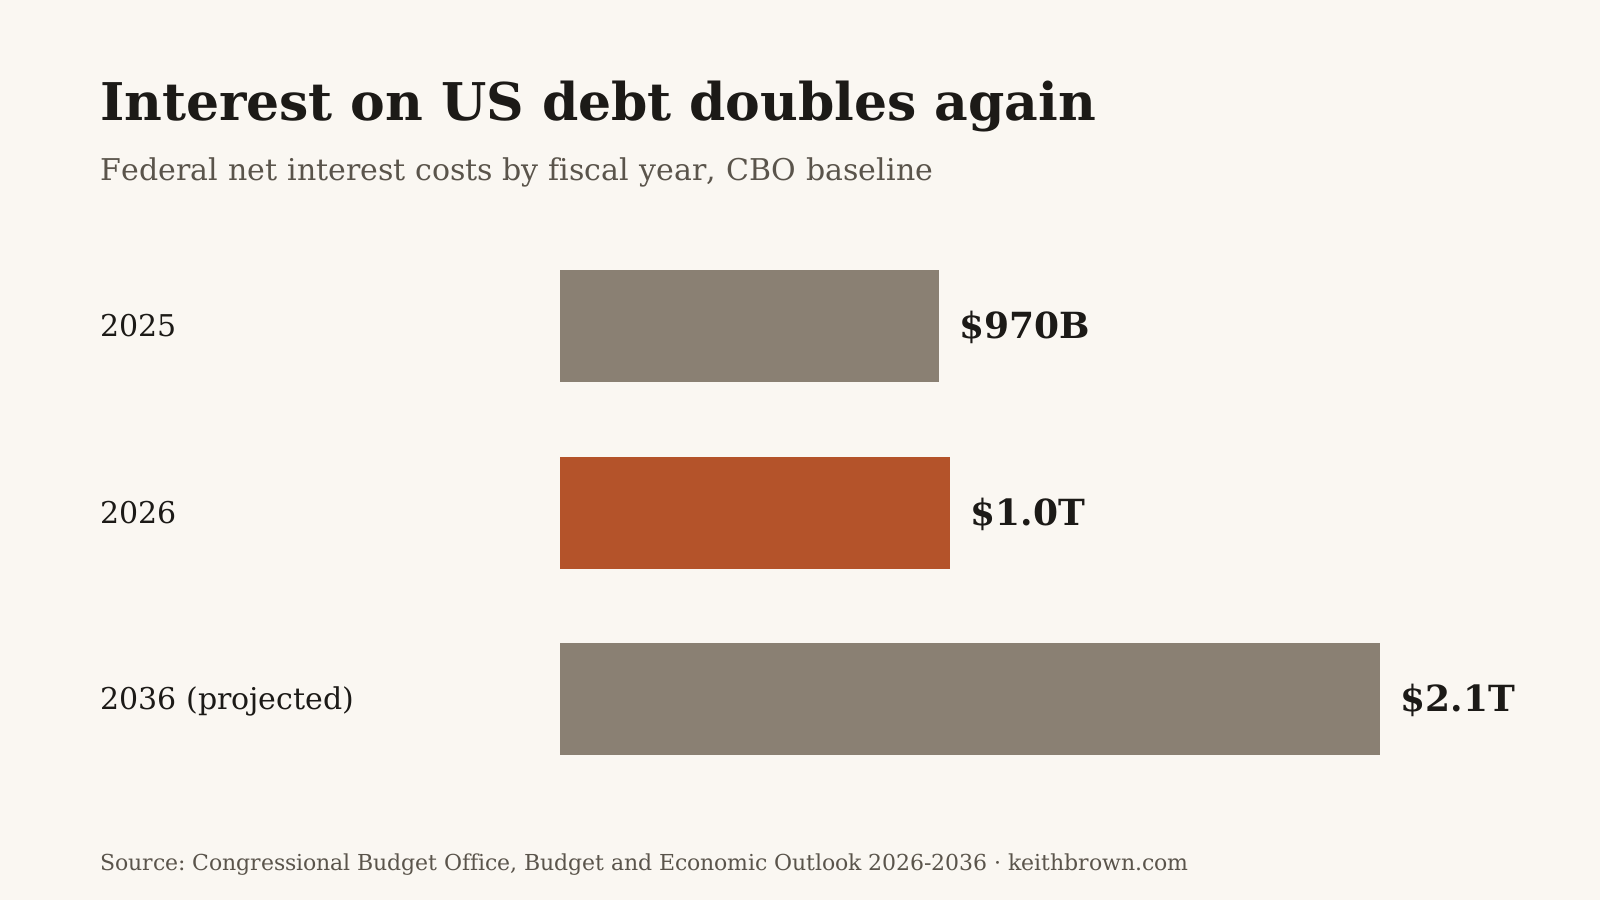
Interest is now the third-largest item in the federal budget and costs more than defense. It is projected to pass Medicare in 2029 and take one quarter of all federal revenue by 2036.
Total federal debt, counting what the government owes its own trust funds, is 121% of GDP, per Treasury and BEA data on FRED. Going into each past downturn it was lower.
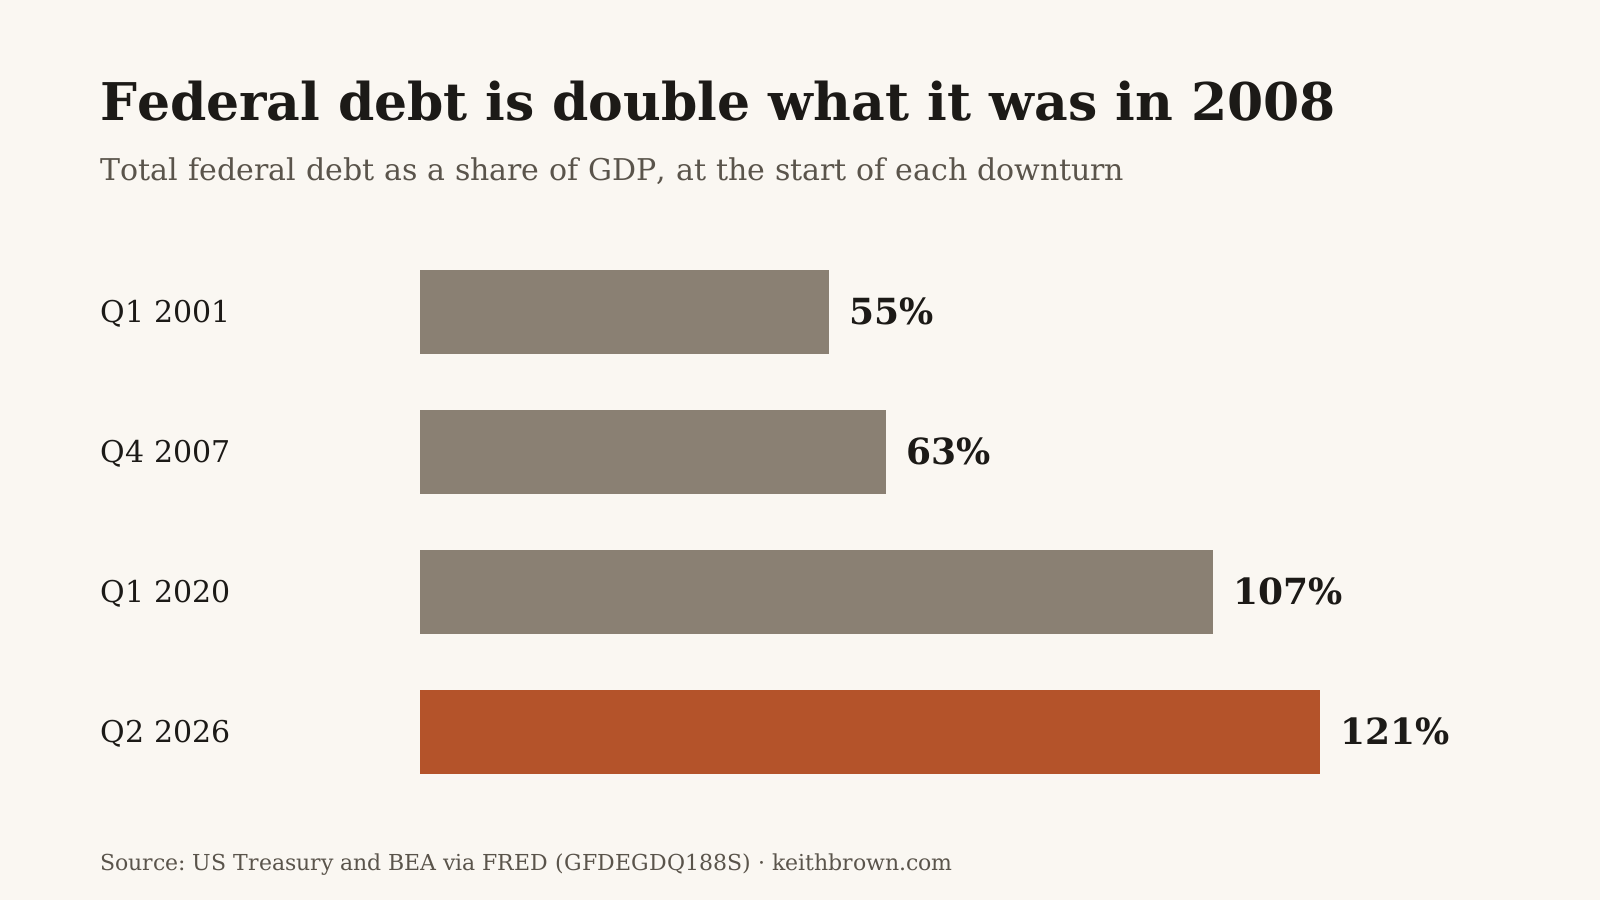
In 2008 and 2020 the government borrowed heavily to soften the downturn. Each rescue started from a lower base than today's.
What rate hikes can and can't reach
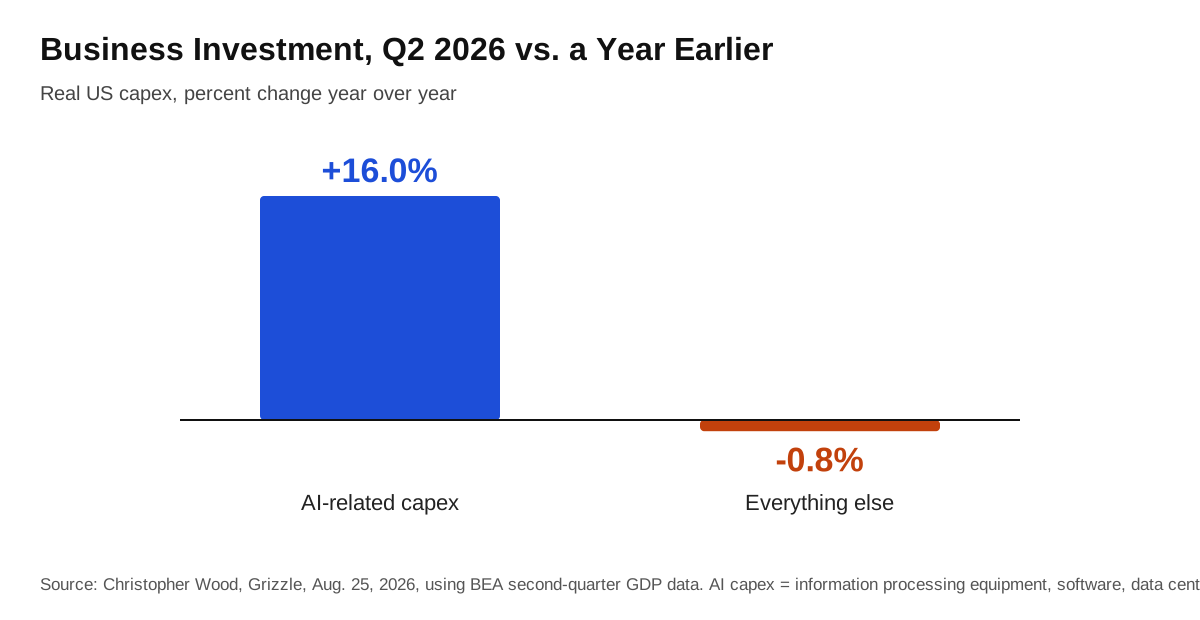
Higher rates slow borrowing and spending. AI spending has not slowed. J.P. Morgan projects about $900 billion of AI capital spending in 2026, revised up from $736 billion after mid-year earnings, and the Fed's minutes name that demand as an inflation risk.
The other cause is war. A rate hike doesn't reopen the Strait of Hormuz. It does raise the cost of a car loan, a small-business line of credit and the federal interest bill. I wrote about how much of the economy now leans on AI spending in is AI propping up the economy?.
What I hear from founders and leaders is more worried than the headlines. They tell me about customers paying later, teams worried about their jobs, and costs that keep rising.
What the facts show: no recession has been declared, job growth beat forecasts and banks are sound. If a downturn does come, the Fed is raising rates instead of cutting, inflation is 3.7% and total federal debt is 121% of GDP, so both usual fixes are harder to use than in 2000, 2008 or 2020. My read is a bumpy two years, and the tables are there so you can reach your own.
How I'd lead through it
I've built through a few of these. The leaders who did well treated hard years as long, not short. They kept more cash than felt comfortable, stayed close to their best customers, and told their teams the truth early.
That is what I'd do now. Plan the next two years as if none of this goes away on its own. If it goes away sooner, you'll have extra cash and a calmer team.
I'm still optimistic about what our founders will build on the other side. I wrote about the people who carry the most of it in the K-shaped economy.