Startup Benchmarks
2026 Startup Benchmarks From Eight Reports
Every key number I pulled from this year's biggest startup and AI reports, with the page it came from and a link to download the full report from the publisher.
Read what they say side by side in I Turned Every VC 'State of' PDF Into a Free MCP, or ask the data yourself.
The sources
KeyBanc Capital Markets
2026 KeyBanc Capital Markets AI x Software BenchmarkNov 13, 2026 · 71 pages
Survey of 81 private software companies, fielded July to September 2026. 2024-2025 are actuals; 2026-2027 are the companies' own forecasts. Figures are medians.
Carta
State of Private Markets: Q3 2026Nov 5, 2026 · 25 pages
Funding rounds recorded by startups that use Carta, mostly US venture-backed companies.
CB Insights
State of Venture Q3'26Oct 6, 2026 · 232 pages
Global equity funding, deals and exits tracked by CB Insights across private venture-backed companies.
Stanford Institute for Human-Centered AI
The AI Index 2026 Annual ReportApr 1, 2026 · 425 pages
Annual research report drawing on public data, research partners and original analysis across AI research, economy, policy and education.
US Census Bureau
Business Trends and Outlook Survey (AI use questions)Nov 5, 2026 · Live data
National survey of US employer businesses every two weeks. Pulled from the public BTOS API and saved with its fetch date.
PitchBook and the National Venture Capital Association
Q3 2026 PitchBook-NVCA Venture MonitorOct 7, 2026 · 36 pages
US venture deals, exits and fundraising tracked by PitchBook, as of Sept. 30, 2026. Recent quarters include estimates.
ICONIQ
2026 State of Scaling: The Great SortingSep 17, 2026 · 52 pages
Quarterly operating and financial data from 137 software companies, mostly ICONIQ portfolio companies plus 11 public companies, through Q2 2026. Pacesetters are top-quartile growth, AI-forward companies.
High Alpha
2026 Startup Benchmarks ReportNov 16, 2026 · 65 pages
Survey of startup founders and finance leaders, 75% in the US, mostly under $20M ARR. Figures are medians by ARR band unless noted.
Bessemer Venture Partners
The AI 100: Benchmarks for the Third SupercycleNov 12, 2026 · 21 pages
Ranking of the 100 most important private AI companies, with valuation, revenue and growth benchmarks, plus a survey of 300+ AI-native companies.
The charts
Every number, by topic
Forecasts are marked. Samples differ, so check the group before you compare two numbers.
Funding
| Number | Group | Period | Value | Source |
|---|---|---|---|---|
| Venture capital raisedAcross 1,179 rounds | Startups on Carta | Q3 2026 | $49.3B | Carta, p. 4 |
| Change in deal count, year over year | All stages | Q3 2026 | -21% | Carta, p. 2 |
| AI startups' share of capital raised | All rounds | 2026 YTD | 52% | Carta, p. 5 |
| AI startups' share of capital raisedDown from 48% in 2025 | Seed and Series A | 2026 YTD | 44% | Carta, p. 5 |
| AI startups' share of capital raisedHighest ever | Series B and later | 2026 YTD | 57% | Carta, p. 5 |
| Seed capital raisedUp 21% YoY across 426 rounds, down 27% | Seed | Q3 2026 | $4.1B | Carta, p. 6 |
| Bay Area share of capital raisedMore than 40% | Bay Area startups | 2026 YTD | 40% | Carta, p. 3 |
| Global venture fundingAll-time annual high | Global | 2026 YTD (Q1-Q3) | $698.3B | CB Insights, p. 4 |
| Global venture deals | Global | Q3 2026 | 6,913 | CB Insights, p. 9 |
| Average venture deal sizeUp from $23M in 2025; median $3.4M | Global | 2026 YTD | $49.8M | CB Insights, p. 4 |
| Share of funding from $100M+ rounds299 of 6,913 deals | Global | Q3 2026 | 80% | CB Insights, p. 4 |
| US venture funding2,882 deals | US | Q3 2026 | $111.1B | CB Insights, p. 10 |
| European venture fundingHighest since Q2 2022 | Europe | Q3 2026 | $31.5B | CB Insights, p. 4 |
| Private AI investment | United States | 2025 | $285.9B | Stanford Institute for Human-Centered AI, p. 11 |
| Private AI investmentExcludes government guidance funds | China | 2025 | $12.4B | Stanford Institute for Human-Centered AI, p. 11 |
| Newly funded AI companies | United States | 2025 | 1,953 | Stanford Institute for Human-Centered AI, p. 11 |
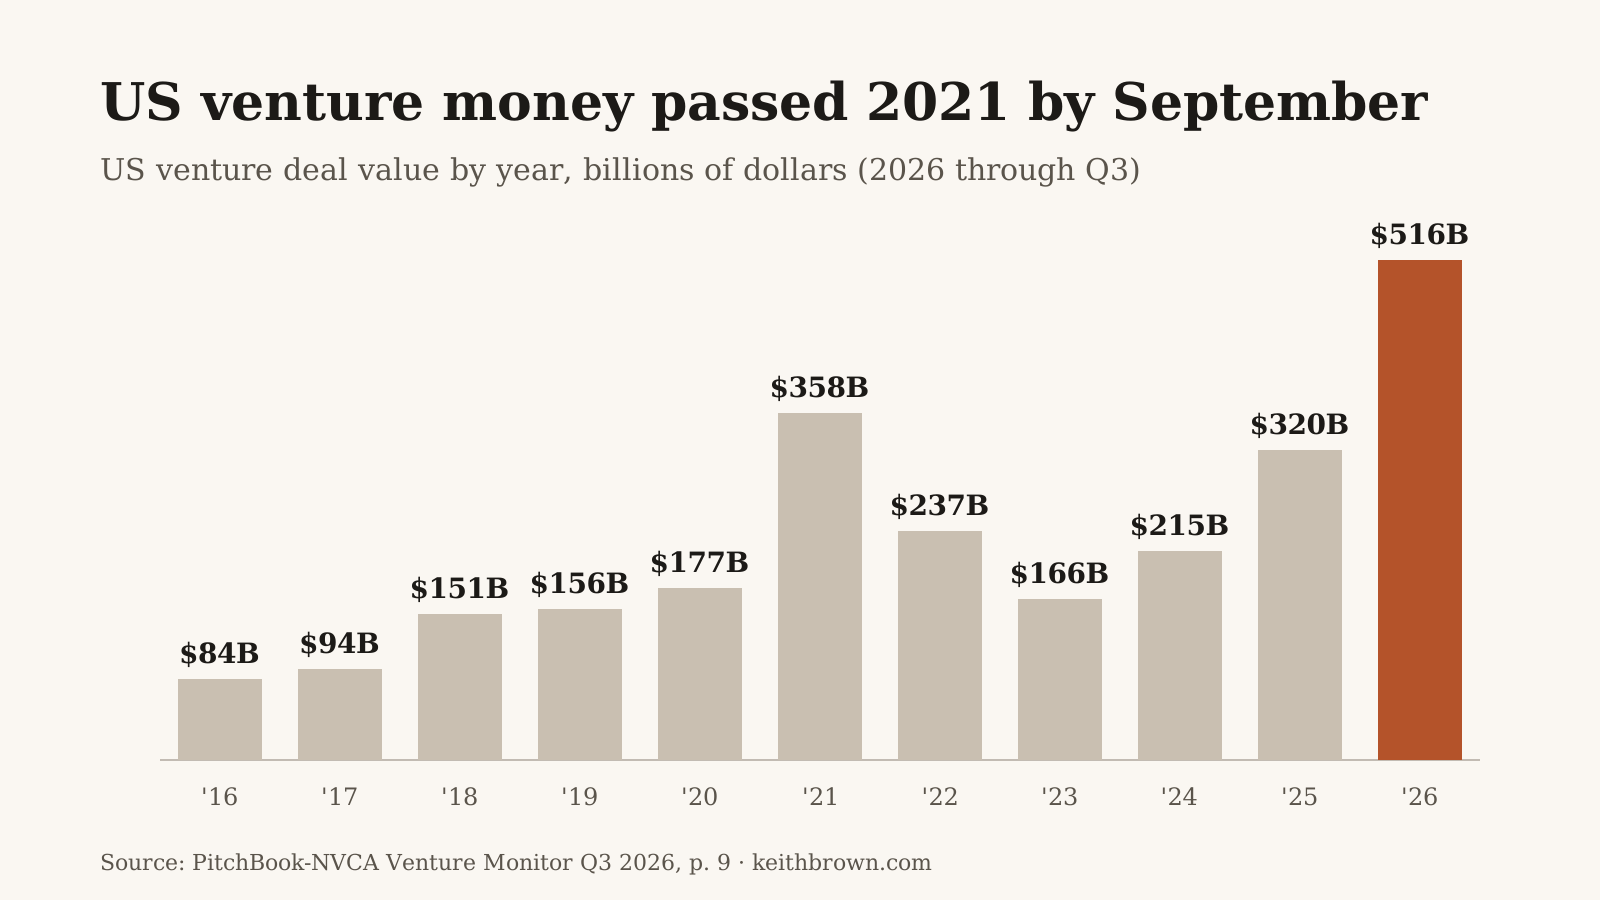
| US venture deal valueAbout 44% above 2021's full-year record of $357.9B; about 14,199 deals | US | 2026 YTD (Q1-Q3) | $515.8B | PitchBook and the National Venture Capital Association, p. 9 |
| US venture deal valueDown about 40% from Q2 across an estimated 5,012 deals | US | Q3 2026 | $98.4B | PitchBook and the National Venture Capital Association, p. 9 |
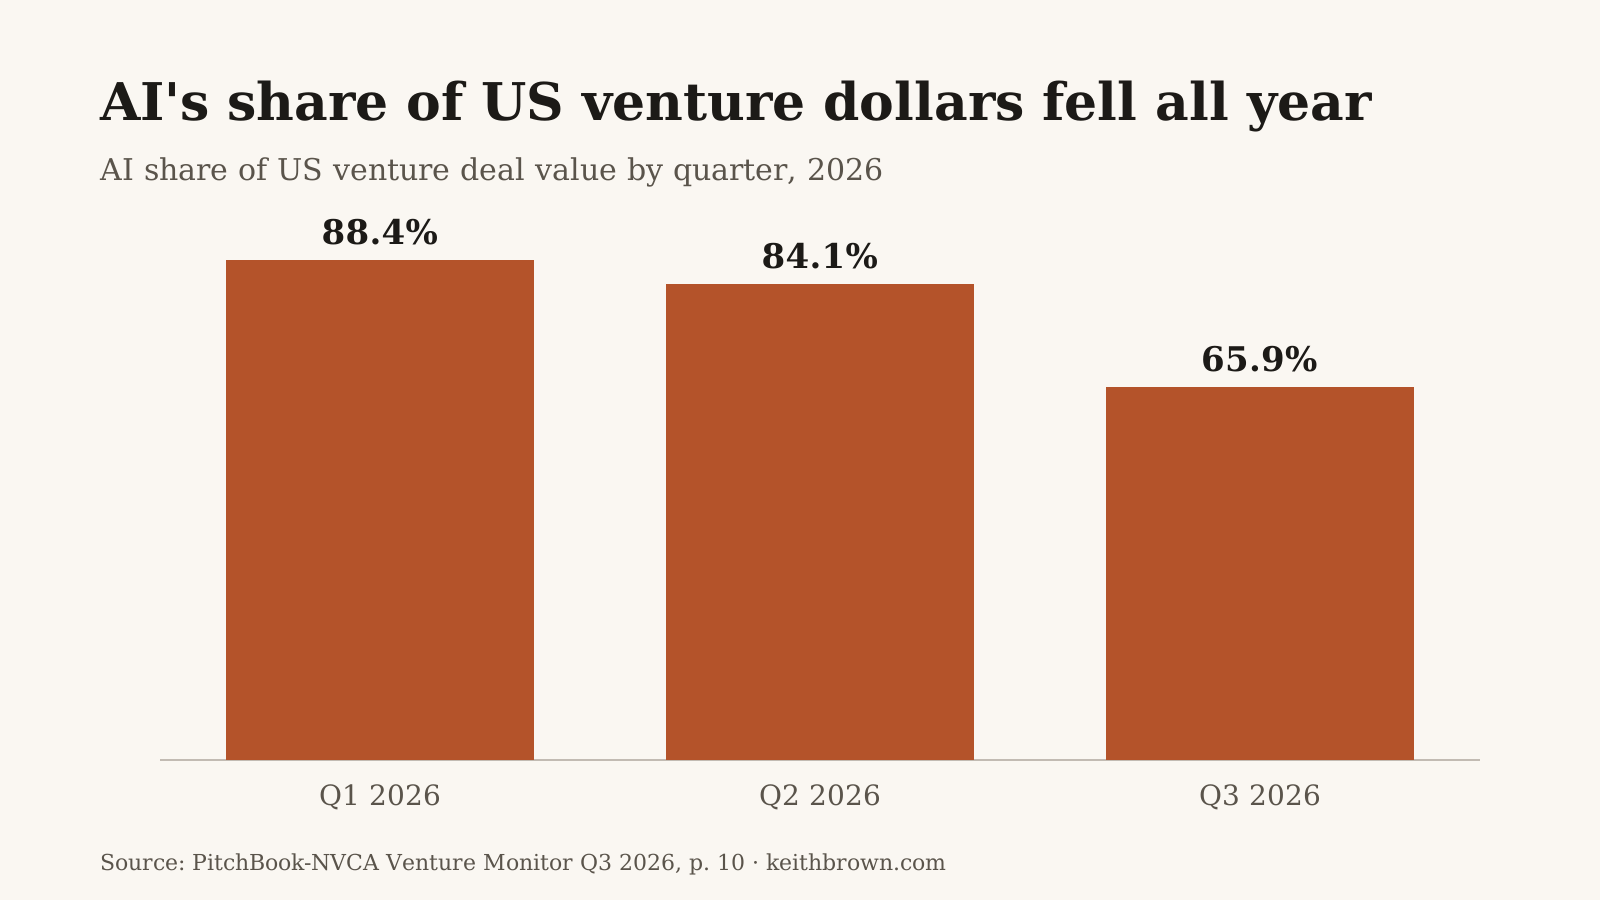
| AI share of venture deal valueHighest annual share in PitchBook's data | US | 2026 YTD | 82.7% | PitchBook and the National Venture Capital Association, p. 9 |
| AI share of venture deal count46% in Q1, 44.4% in Q2 | US | Q3 2026 | 44.9% | PitchBook and the National Venture Capital Association, p. 10 |
| Capital raised by US venture funds | US VC funds | 2026 YTD | $108.5B | PitchBook and the National Venture Capital Association, p. 6 |
| Capital raised | AI 100 (median) | 2026 | $1.09B | Bessemer Venture Partners, p. 1 |
Valuations
| Number | Group | Period | Value | Source |
|---|---|---|---|---|
| Median seed valuationUp 84% from 2021 | Seed | 2026 YTD | $19.7M | Carta, p. 7 |
| Median Series A valuationUp 56% from 2021 | Series A | 2026 YTD | $63.3M | Carta, p. 7 |
| Down rounds as share of all roundsLowest in four years | All stages | Q3 2026 | 13% | Carta, p. 11 |
| Compounded dilution, seed through Series D at median ratesVersus 66% at 2019 rates | Hypothetical company | 2026 | 53% | Carta, p. 10 |
| Median AI valuation step-upHighest since ChatGPT launched in November 2022 | US AI startups | 2026 | 2.2x | PitchBook and the National Venture Capital Association, p. 5 |
| New unicornsMore than have gone public in any year except 2021 | US | 2026 YTD | 179 | PitchBook and the National Venture Capital Association, p. 5 |
| AI pre-money valuation premium over non-AI peersAbout 34% at seed | Series B and C | 2026 | 130% | High Alpha, p. 18 |
| Combined value of the AI 100More than 3x the $1.1T 2025 Cloud 100 | AI 100 | 2026 | $3,600B | Bessemer Venture Partners, p. 5 |
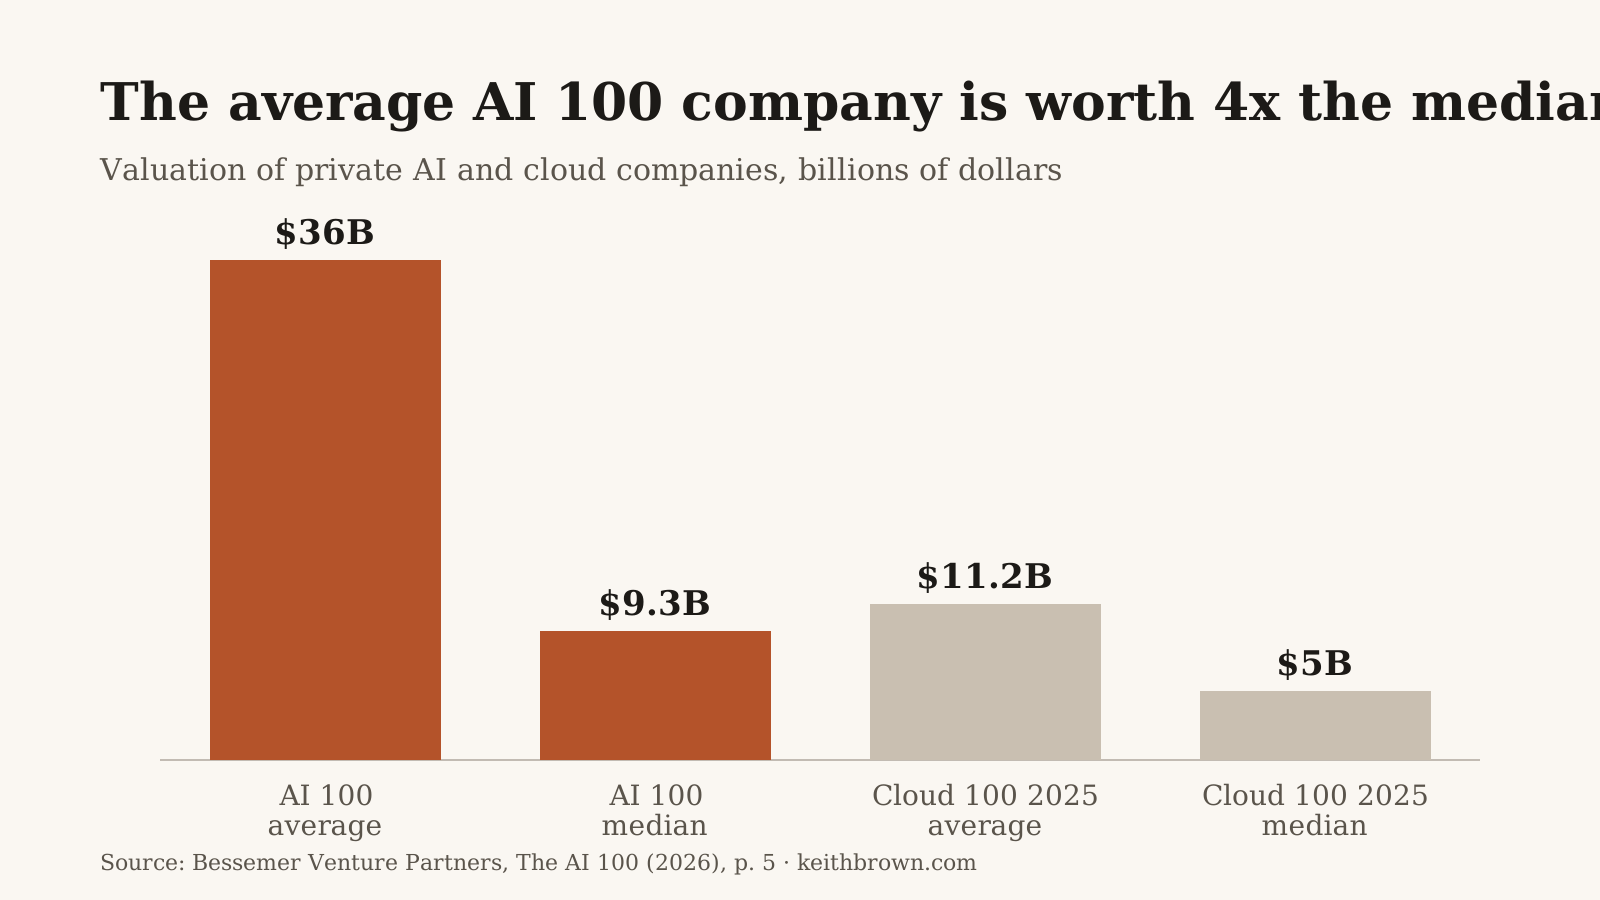
| Average valuationMedian $9.3B; 2025 Cloud 100 average $11.2B, median $5B | AI 100 | 2026 | $36B | Bessemer Venture Partners, p. 5 |
| Median valuation | AI 100 | 2026 | $9.3B | Bessemer Venture Partners, p. 1 |
| Share of list value held by the top 10 | AI 100 | 2026 | 70% | Bessemer Venture Partners, p. 1 |
| Share of list value held by frontier labs and model builders | 9% of the AI 100 | 2026 | 55% | Bessemer Venture Partners, p. 1 |
| ARR multipleCloud 100 peak was 34x in 2021; AI 100 median 23x | AI 100 (average) | 2026 | 57x | Bessemer Venture Partners, p. 5 |
Growth
| Number | Group | Period | Value | Source |
|---|---|---|---|---|
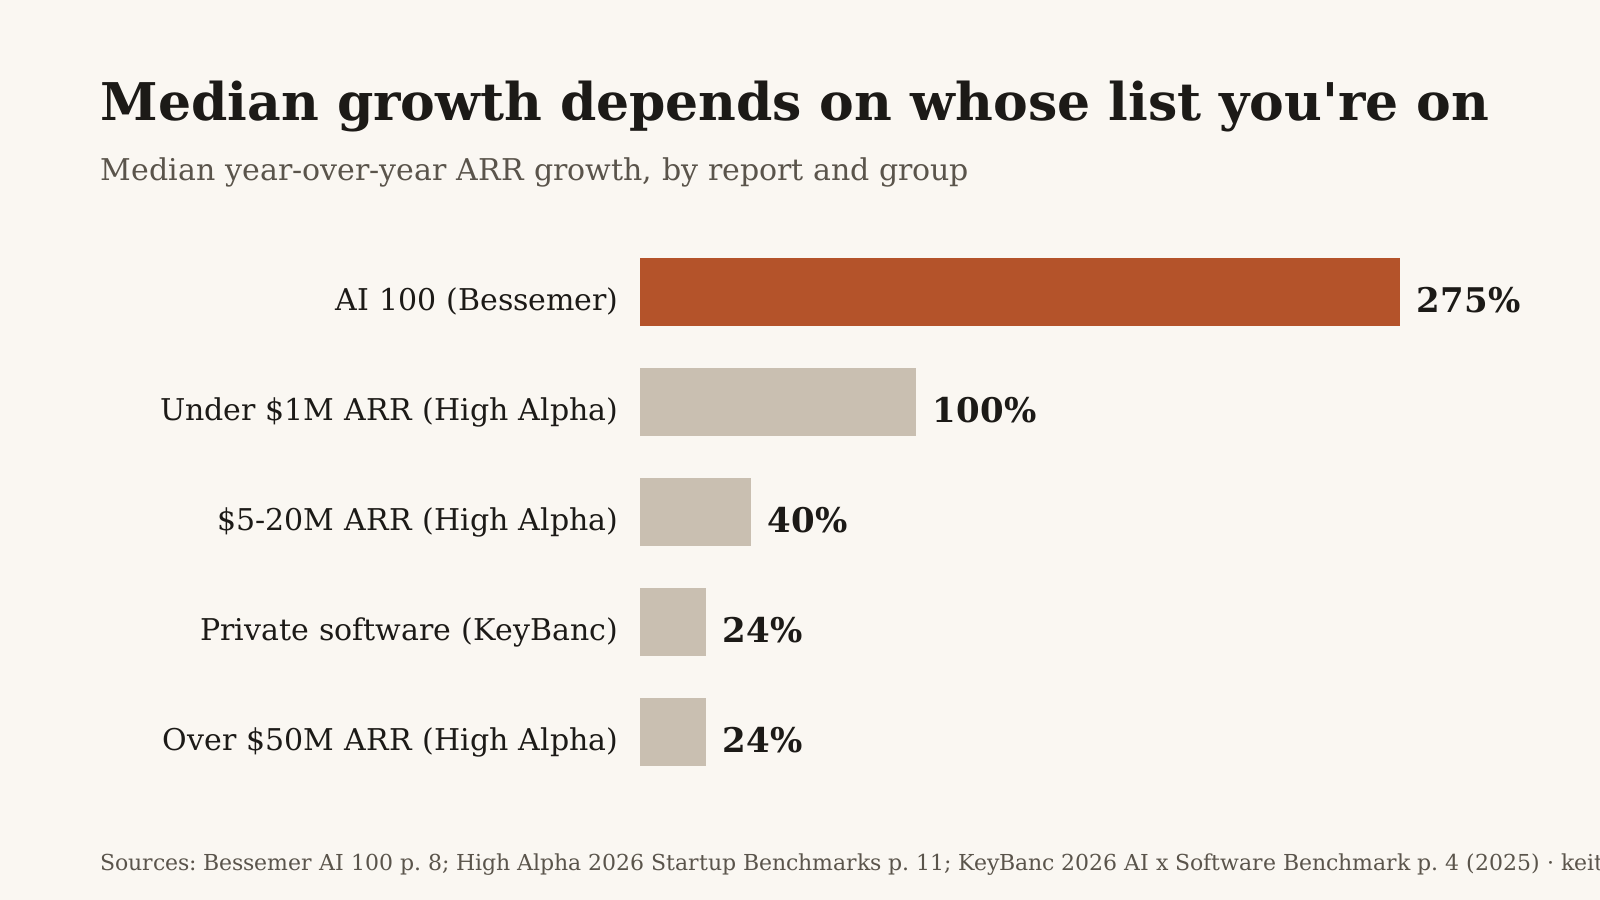
| ARR growth | Private software companies (median) | 2024 | 21% | KeyBanc Capital Markets, p. 4 |
| ARR growth | Private software companies (median) | 2025 | 24% | KeyBanc Capital Markets, p. 4 |
| ARR growthCompany forecast, not an actual | Private software companies (median) | 2026E | 23% | KeyBanc Capital Markets, p. 4 |
| ARR growthCompany forecast, not an actual | Private software companies (median) | 2027E | 40% | KeyBanc Capital Markets, p. 4 |
| ARR growth | AI sold as the core product (median) | 2025 | 34% | KeyBanc Capital Markets, p. 14 |
| ARR growth | AI embedded in a broader product (median) | 2025 | 22% | KeyBanc Capital Markets, p. 14 |
| New-customer ARR as share of gross new revenue70%+; other companies lean more on expansion | Pacesetters | 2026 | 70% | ICONIQ, p. 9 |
| Software companies in the studyIncludes 11 public companies | ICONIQ dataset | 2026 | 137 | ICONIQ, p. 4 |
| Year-over-year growth rate | Under $1M ARR (median) | 2026 | 100% | High Alpha, p. 11 |
| Year-over-year growth rate | $1-5M ARR (median) | 2026 | 51% | High Alpha, p. 11 |
| Year-over-year growth rate | $5-20M ARR (median) | 2026 | 40% | High Alpha, p. 11 |
| Year-over-year growth rate | $20-50M ARR (median) | 2026 | 35% | High Alpha, p. 11 |
| Year-over-year growth rate | Over $50M ARR (median) | 2026 | 24% | High Alpha, p. 11 |
| ARR growthAbout 6x the Cloud 100 | AI 100 (average) | 2026 | 480% | Bessemer Venture Partners, p. 5 |
| ARR growth | AI 100 (median) | 2026 | 275% | Bessemer Venture Partners, p. 1 |
Efficiency
| Number | Group | Period | Value | Source |
|---|---|---|---|---|
| CAC payback | Private software companies (median) | 2024 | 20 months | KeyBanc Capital Markets, p. 4 |
| CAC payback | Private software companies (median) | 2025 | 21 months | KeyBanc Capital Markets, p. 4 |
| CAC paybackCompany forecast, not an actual | Private software companies (median) | 2026E | 19 months | KeyBanc Capital Markets, p. 4 |
| CAC paybackCompany forecast, not an actual | Private software companies (median) | 2027E | 17 months | KeyBanc Capital Markets, p. 4 |
| Gross magic number | Private software companies (median) | 2024 | 0.76x | KeyBanc Capital Markets, p. 4 |
| Gross magic number | Private software companies (median) | 2025 | 0.76x | KeyBanc Capital Markets, p. 4 |
| Gross magic numberCompany forecast, not an actual | Private software companies (median) | 2026E | 0.79x | KeyBanc Capital Markets, p. 4 |
| Gross magic numberCompany forecast, not an actual | Private software companies (median) | 2027E | 0.97x | KeyBanc Capital Markets, p. 4 |
| Account executive productivity (new ARR per AE) | Private software companies (median) | 2025 | $411K | KeyBanc Capital Markets, p. 4 |
| Account executive productivity (new ARR per AE)Company forecast, not an actual | Private software companies (median) | 2026E | $450K | KeyBanc Capital Markets, p. 4 |
| Account executive productivity (new ARR per AE)Company forecast, not an actual | Private software companies (median) | 2027E | $487K | KeyBanc Capital Markets, p. 4 |
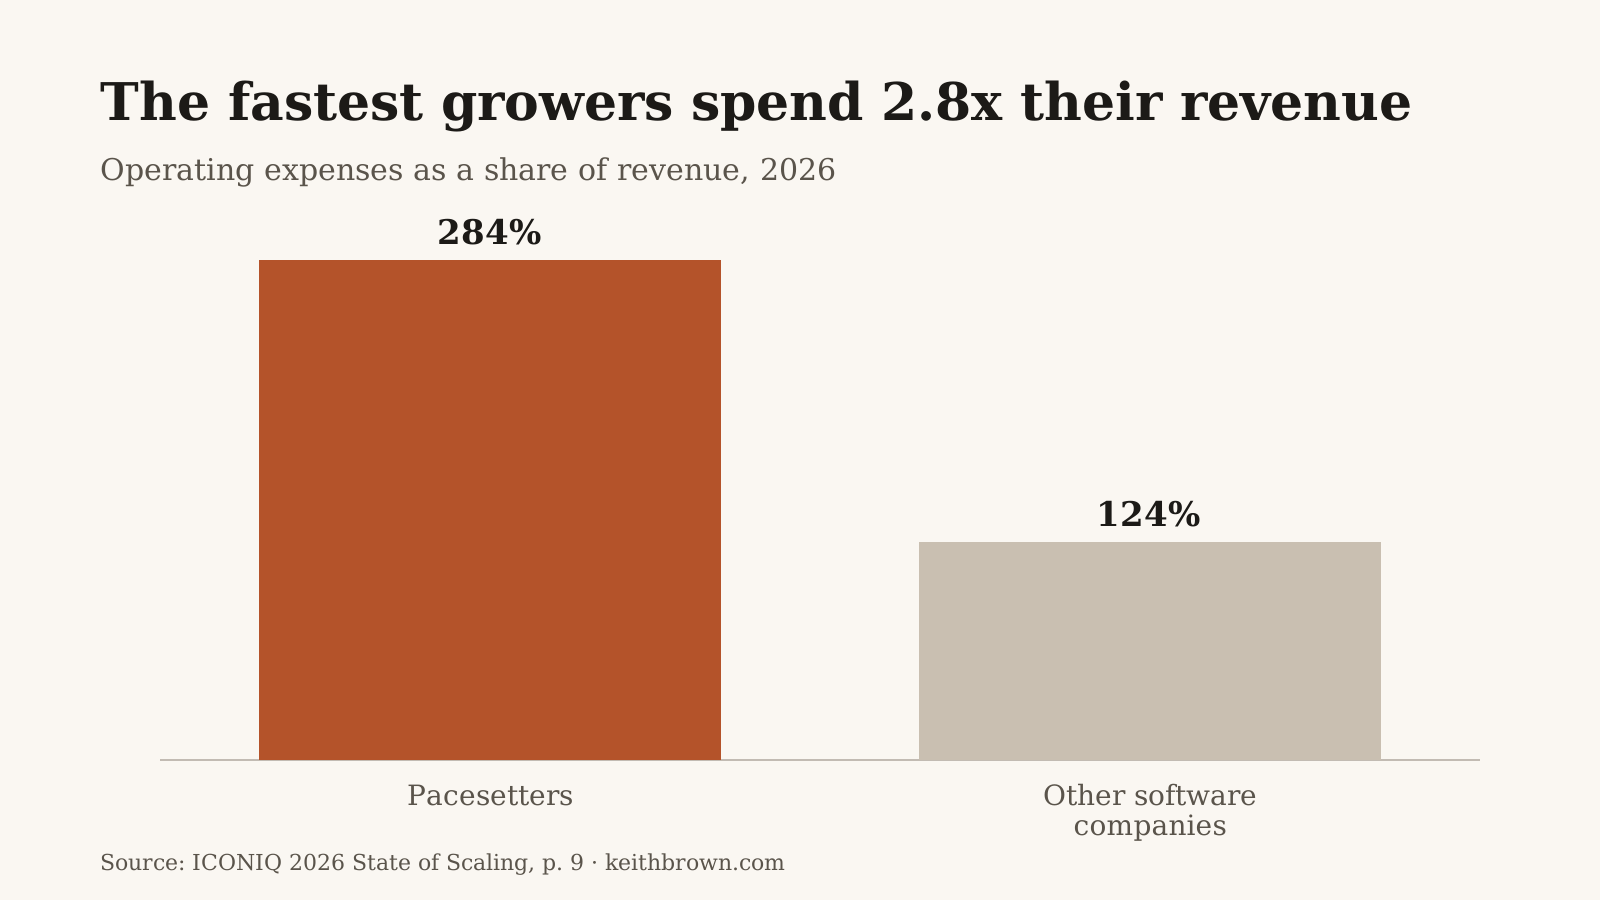
| Operating expenses as share of revenueVersus 124% for other software companies | Pacesetters | 2026 | 284% | ICONIQ, p. 9 |
| Operating expenses as share of revenue | Other software companies | 2026 | 124% | ICONIQ, p. 9 |
| ARR per employee, top quartileBottom quartile $225K | $20-50M ARR | 2026 | $689K | High Alpha, p. 22 |
| ARR per employee, bottom quartile | $20-50M ARR | 2026 | $225K | High Alpha, p. 22 |
Profitability
| Number | Group | Period | Value | Source |
|---|---|---|---|---|
| Gross margin | Private software companies (median) | 2024 | 75% | KeyBanc Capital Markets, p. 4 |
| Gross margin | Private software companies (median) | 2025 | 76% | KeyBanc Capital Markets, p. 4 |
| Gross marginCompany forecast, not an actual | Private software companies (median) | 2026E | 77% | KeyBanc Capital Markets, p. 4 |
| Gross marginCompany forecast, not an actual | Private software companies (median) | 2027E | 78% | KeyBanc Capital Markets, p. 4 |
| EBITDA margin | Private software companies (median) | 2024 | -6% | KeyBanc Capital Markets, p. 4 |
| EBITDA margin | Private software companies (median) | 2025 | -3% | KeyBanc Capital Markets, p. 4 |
| EBITDA marginCompany forecast, not an actual | Private software companies (median) | 2026E | 1% | KeyBanc Capital Markets, p. 4 |
| EBITDA marginCompany forecast, not an actual | Private software companies (median) | 2027E | 8% | KeyBanc Capital Markets, p. 4 |
| Rule of 40 | Private software companies (median) | 2024 | 13% | KeyBanc Capital Markets, p. 4 |
| Rule of 40 | Private software companies (median) | 2025 | 16% | KeyBanc Capital Markets, p. 4 |
| Rule of 40Company forecast, not an actual | Private software companies (median) | 2026E | 20% | KeyBanc Capital Markets, p. 4 |
| Rule of 40Company forecast, not an actual | Private software companies (median) | 2027E | 44% | KeyBanc Capital Markets, p. 4 |
| EBITDA margin | AI sold as the core product (median) | 2025 | -12% | KeyBanc Capital Markets, p. 14 |
| EBITDA margin | AI embedded in a broader product (median) | 2025 | -1% | KeyBanc Capital Markets, p. 14 |
| How much more unprofitable Pacesetters under $100M ARR are than peersRoughly 5.6x, by FCF margin | Pacesetters under $100M ARR | 2026 | 5.6x | ICONIQ, p. 9 |
| Share cash-flow positive or neutralVersus 14% for larger teams | Below-median headcount for ARR band | 2026 | 36% | High Alpha, p. 22 |
Retention
| Number | Group | Period | Value | Source |
|---|---|---|---|---|
| Gross dollar retention | Private software companies (median) | 2024 | 88% | KeyBanc Capital Markets, p. 4 |
| Gross dollar retention | Private software companies (median) | 2025 | 89% | KeyBanc Capital Markets, p. 4 |
| Gross dollar retentionCompany forecast, not an actual | Private software companies (median) | 2026E | 91% | KeyBanc Capital Markets, p. 4 |
| Gross dollar retentionCompany forecast, not an actual | Private software companies (median) | 2027E | 93% | KeyBanc Capital Markets, p. 4 |
| Net dollar retention | Private software companies (median) | 2024 | 100% | KeyBanc Capital Markets, p. 4 |
| Net dollar retention | Private software companies (median) | 2025 | 102% | KeyBanc Capital Markets, p. 4 |
| Net dollar retentionCompany forecast, not an actual | Private software companies (median) | 2026E | 101% | KeyBanc Capital Markets, p. 4 |
| Net dollar retentionCompany forecast, not an actual | Private software companies (median) | 2027E | 105% | KeyBanc Capital Markets, p. 4 |
Teams and talent
| Number | Group | Period | Value | Source |
|---|---|---|---|---|
| Change in employment, US software developers ages 22-25Nearly 20% decline | United States | 2024-2026 | -20% | Stanford Institute for Human-Centered AI, p. 11 |
| Change in AI researchers moving to the US since 2017 | United States | 2017-2025 | -89% | Stanford Institute for Human-Centered AI, p. 11 |
| Year-over-year headcount growthVersus 115% in 2025 | Companies growing 100%+ | 2026 | 146% | ICONIQ, p. 10 |
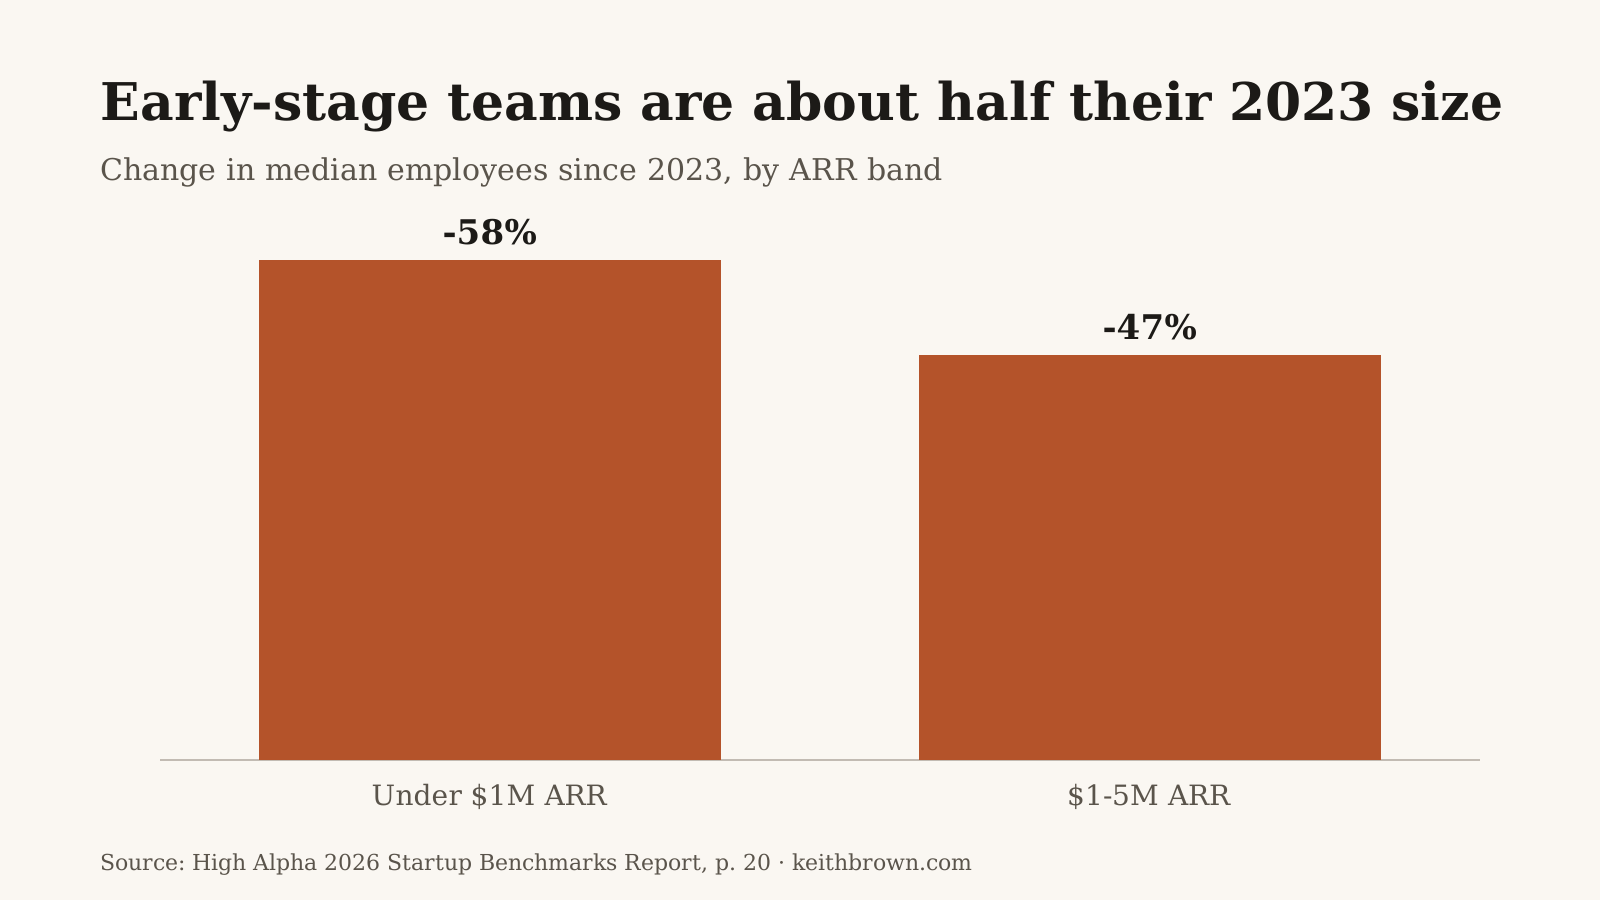
| Change in median employees since 2023 | Under $1M ARR | 2023-2026 | -58% | High Alpha, p. 20 |
| Change in median employees since 2023ARR per employee about doubled in both bands | $1-5M ARR | 2023-2026 | -47% | High Alpha, p. 20 |
| Companies that reduced headcount due to AI52% of companies founded 2022 or later | Founded 2021 or earlier | 2026 | 64% | High Alpha, p. 48 |
| AI-driven cuts that hit engineeringMost common function cut | Companies that cut headcount due to AI | 2026 | 41% | High Alpha, p. 49 |
AI adoption
| Number | Group | Period | Value | Source |
|---|---|---|---|---|
| Respondents whose customers use AI coding tools to rebuild their features | Private software companies | 2026 | 43% | KeyBanc Capital Markets, p. 53 |
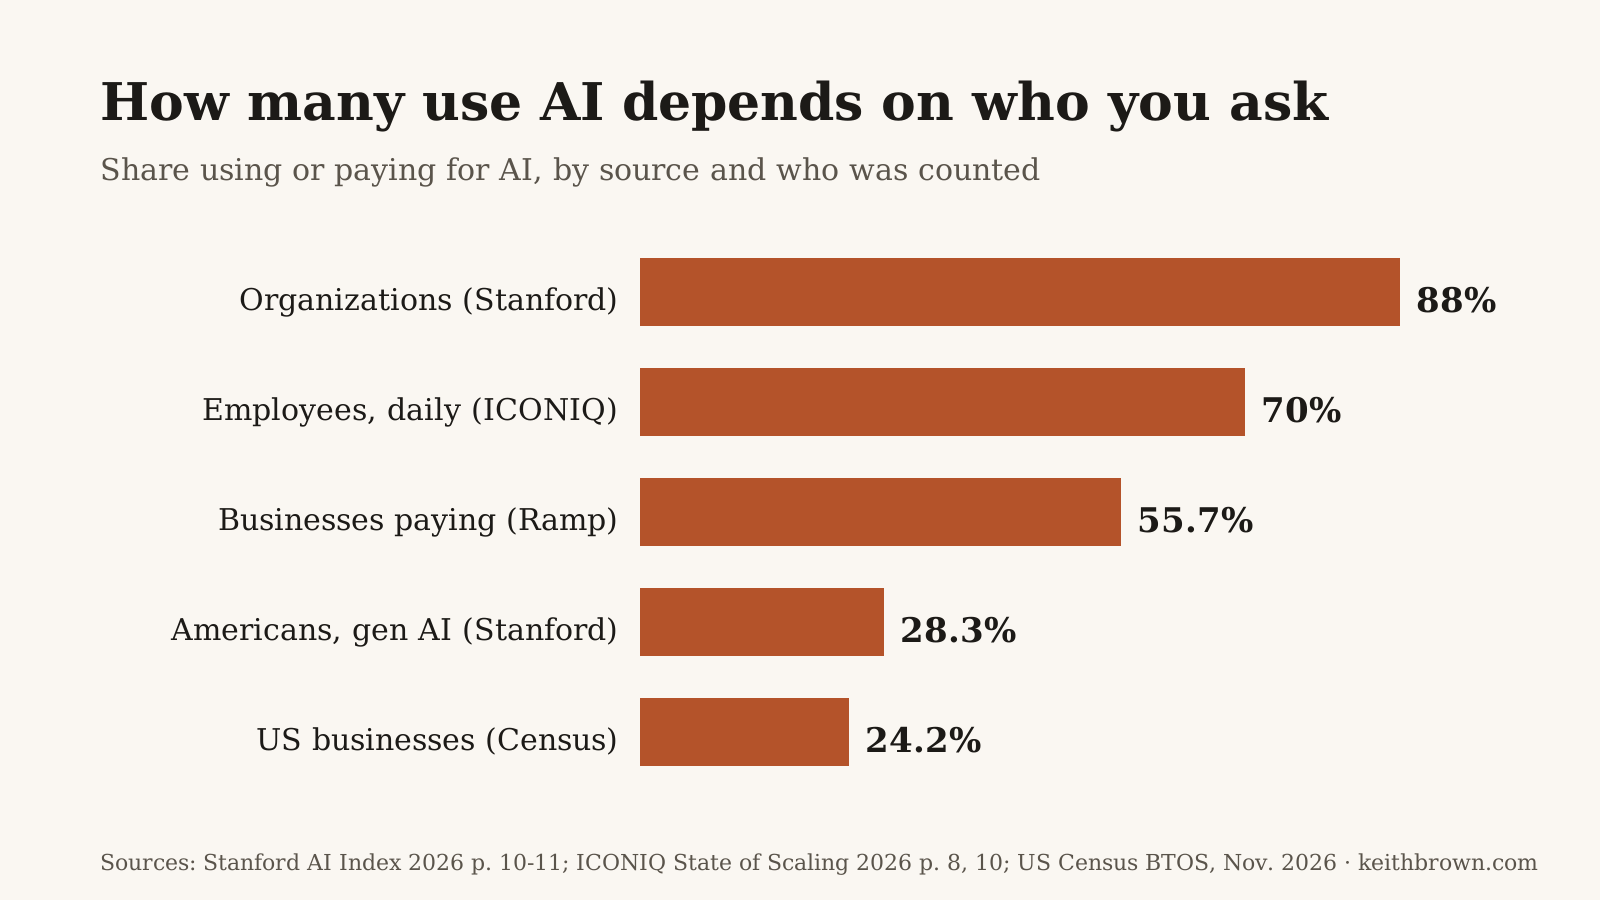
| Organizations using AI | Global | 2025 | 88% | Stanford Institute for Human-Centered AI, p. 10 |
| Generative AI population adoptionWithin three years | Global | 2026 | 53% | Stanford Institute for Human-Centered AI, p. 11 |
| Generative AI population adoptionRanks 24th | United States | 2026 | 28.3% | Stanford Institute for Human-Centered AI, p. 11 |
| Generative AI population adoption | Singapore | 2026 | 61% | Stanford Institute for Human-Centered AI, p. 11 |
| Generative AI population adoption | United Arab Emirates | 2026 | 64% | Stanford Institute for Human-Centered AI, p. 11 |
| US businesses paying for AI tools (Ramp AI Index)Up from 7.5% in January 2023 | US businesses on Ramp | July 2026 | 55.7% | ICONIQ, p. 8 |
| Employees who use AI tools daily70%+ | ICONIQ portfolio companies (average) | Early 2026 | 70% | ICONIQ, p. 10 |
| Businesses on Ramp paying for AIAt least 56%; up 12 points in a year | US businesses on Ramp | 2026 | 56% | High Alpha, p. 15 |
| US businesses that used AI in the last two weeks | All US employer businesses | 10/19/2026 - 11/1/2026 | 24.2% | US Census Bureau |
AI revenue
| Number | Group | Period | Value | Source |
|---|---|---|---|---|
| AI-driven ARR growthUp from 74% in 2025; 21 respondents | Companies reporting AI-driven ARR | 2026E | 128% | KeyBanc Capital Markets, p. 5 |
| AI-driven ARR as share of total ARR42 respondents | Companies reporting AI-driven ARR | 2026E | 12% | KeyBanc Capital Markets, p. 5 |
| Growth in spend on AI-core products (Zylo)Versus 59% for products where AI is a supporting feature | Buyers | 2026 | 354% | High Alpha, p. 16 |
| AI companies that expect value to go to the application layer | 300+ AI-native companies surveyed | 2026 | 87% | Bessemer Venture Partners, p. 1 |
Exits
| Number | Group | Period | Value | Source |
|---|---|---|---|---|
| M&A exitsLowest since 2022 | Global | Q3 2026 | 2,353 | CB Insights, p. 4 |
| Companies that went public12 were healthcare-related | US VC-backed | Q3 2026 | 18 | PitchBook and the National Venture Capital Association, p. 4 |
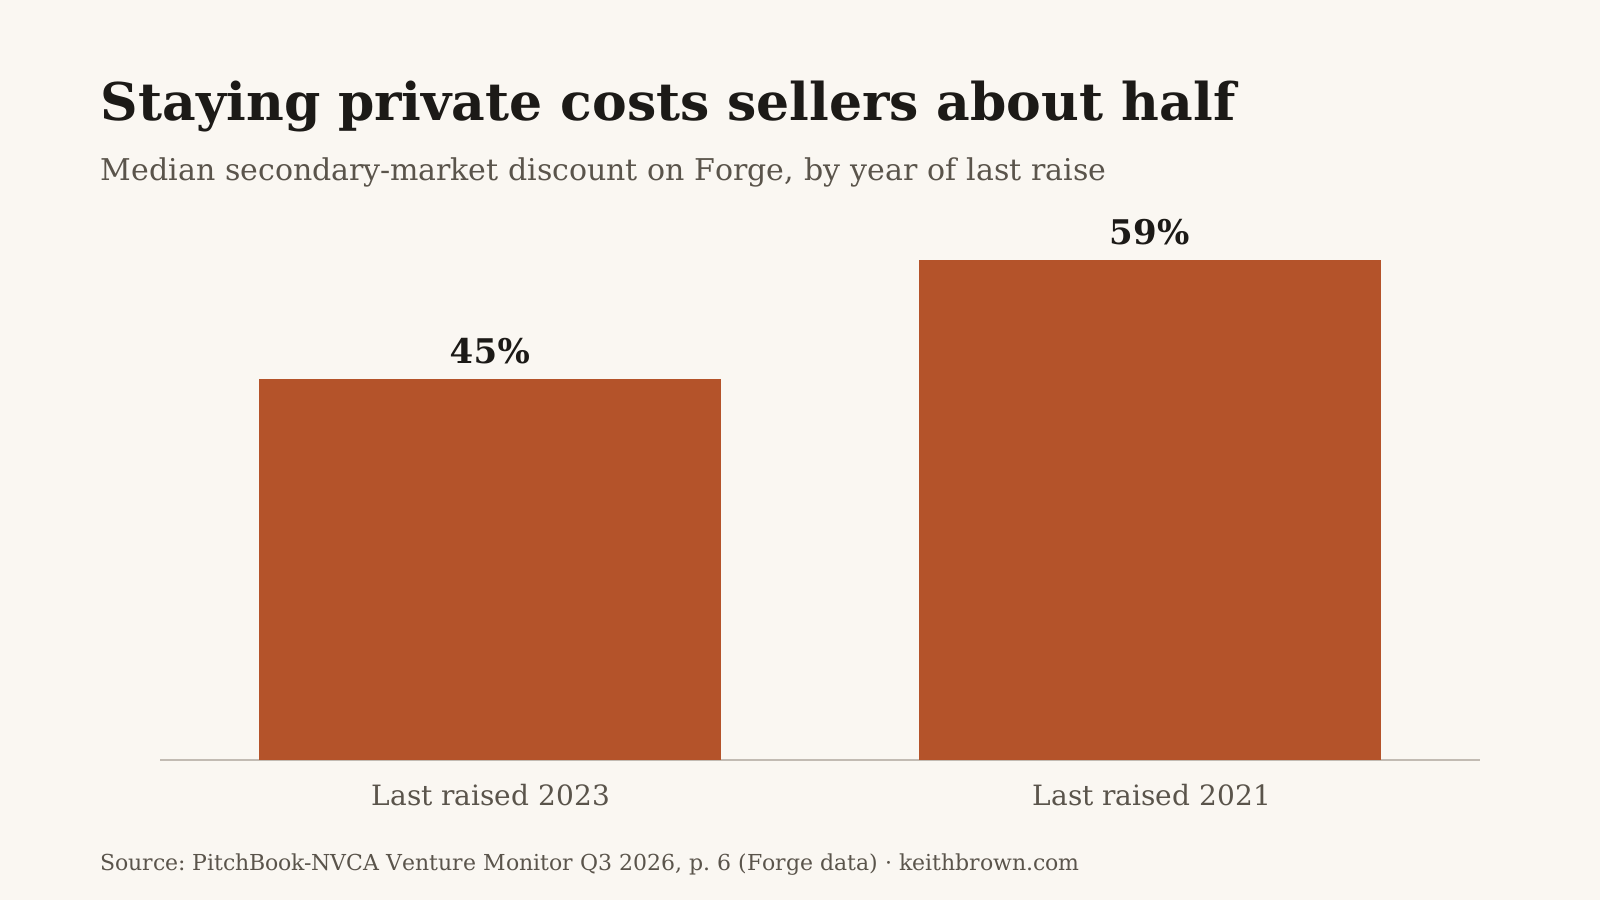
| Median secondary-market discount (Forge) | Companies that last raised in 2023 | 2026 | 45% | PitchBook and the National Venture Capital Association, p. 6 |
| Median secondary-market discount (Forge) | Companies that last raised in 2021 | 2026 | 59% | PitchBook and the National Venture Capital Association, p. 6 |